How do you know if your brand’s rollout is on track to meet your launch goals?
Historical data shouldn’t be the only guide to decision making on order quantities for POS material rollouts. “What we produced before,” makes a lot of assumptions about demand and isn’t enough information to act on to optimize sell in.
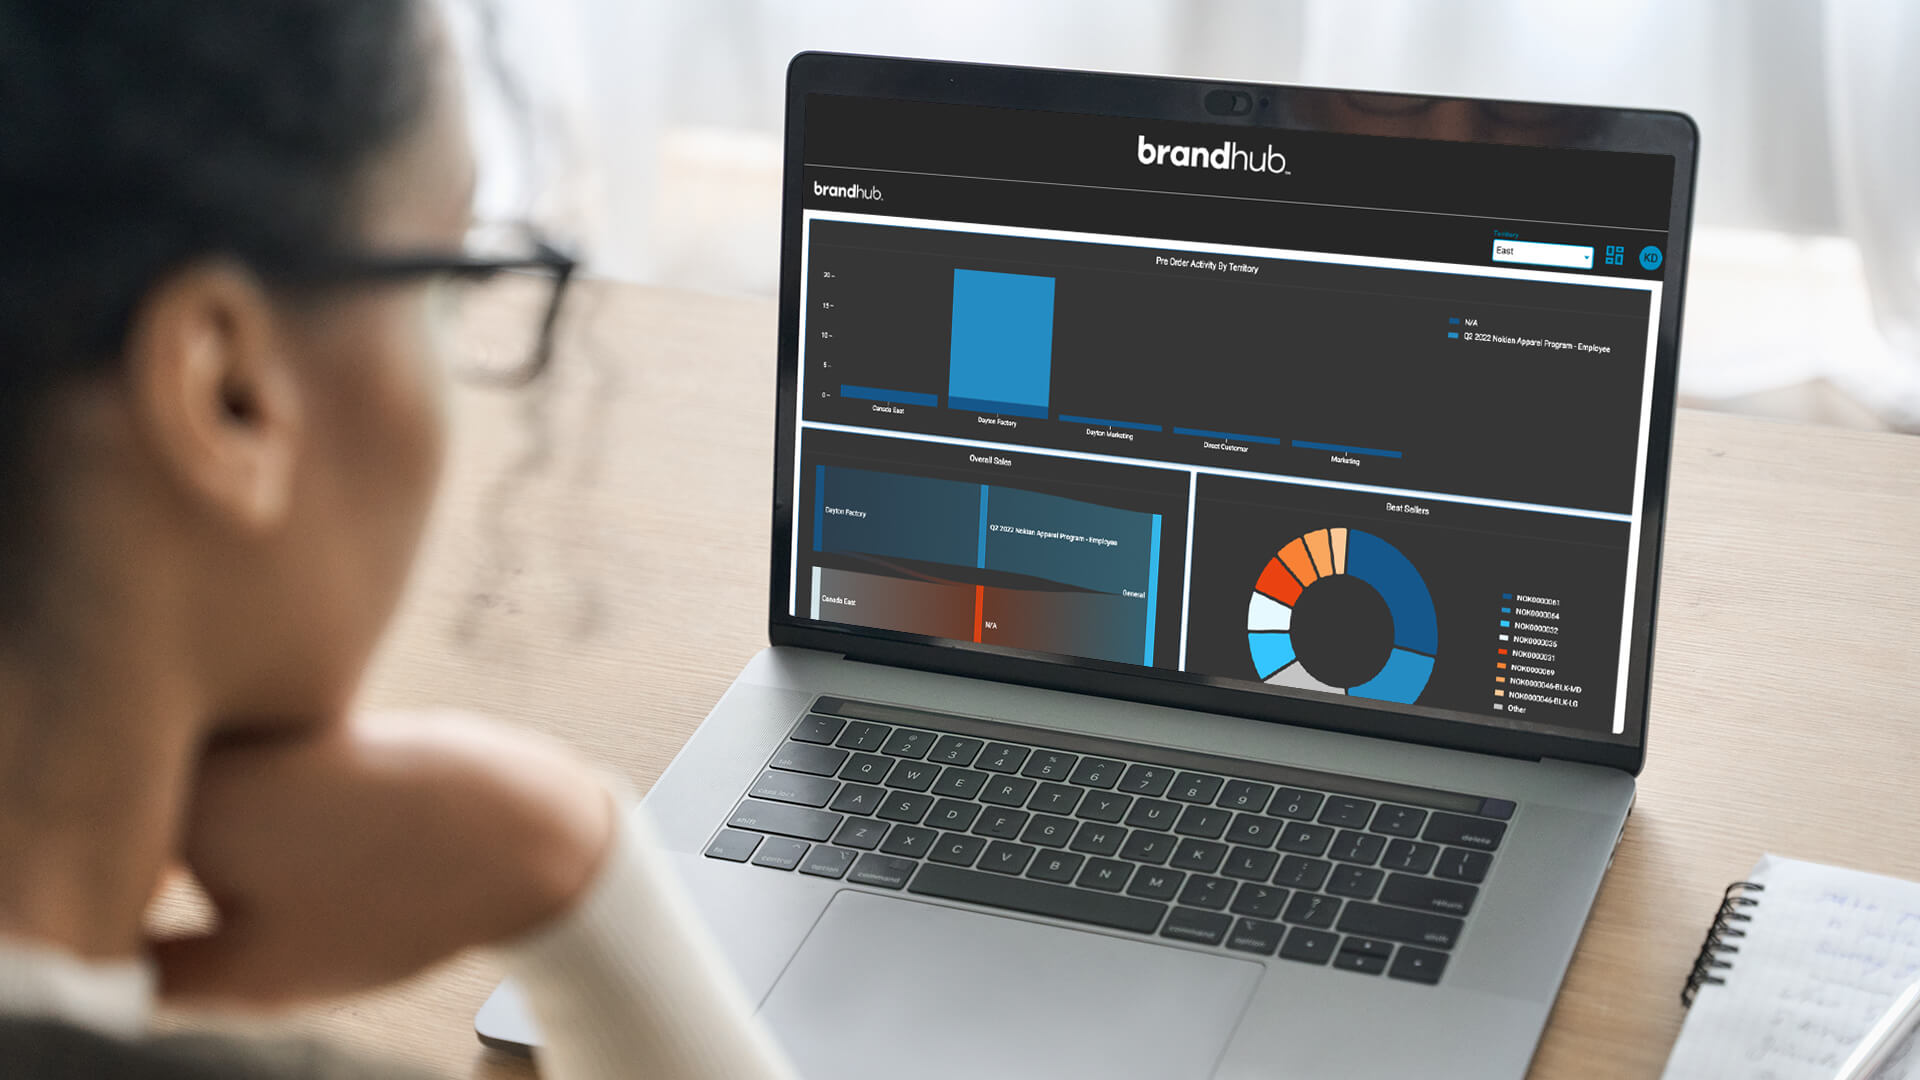
We created the Analytics Dashboard in brandhub, our go-to-market execution software, to give you visibility into how your promotion rolls out in real-time with robust visualizations and reports right at your fingertips. Get your retail promotions in front of more consumers by taking action with Analytics Dashboard.
Key Features:
- Explore your team’s order activity by leveraging filters to slice through data
- $ by State Heat Map gives you visibility into frequent ship-to locations
- Overall Spend Chart indicates what products are being ordered in each territory
- Pre Order Early Warning helps track campaign performance against goals
- Interactive inventory charts for Best Sellers and On Hand
- View, drill down, and download images for presentations
The Analytics Dashboard is now live on brandhub.